State Machines
State Machine Example
 1 digraph{
 2    graph [ dpi = 300 ];
 3    rankdir = LR;
 4    //Declare state nodes
 5    stateA [label="State A"];
 6    stateB [label="State B"];
 7    stateC [label="State C"];
 8    stateD [label="State D"];
 9    stateE [label="Emergency",color="yellow2"];
10
11    //Declare self trasitions
12    stateA->stateA[label="ST-1",color="gray"];
13    stateB->stateB[label="ST-2",color="gray"];
14    stateC->stateC[label="ST-3",color="gray"];
15    stateD->stateD[label="ST-4",color="gray"];
16    stateE->stateE[label="ST-5",color="red"];
17
18    //Declare interstate transitions
19    stateA->stateB[label="T-1"]
20    stateB->stateC[label="T-2"]
21    stateC->stateD[label="T-3"]
22    stateD->stateA[label="T-4"]
23
24
25    //Declare emergency transitions
26    stateA->stateE[label="E-1",color="red"];
27    stateB->stateE[label="E-2",color="red"];
28    stateC->stateE[label="E-3",color="red"];
29    stateD->stateE[label="E-4",color="red"];
30    stateE->stateA[label="R-1",color="blue"];
31
32}
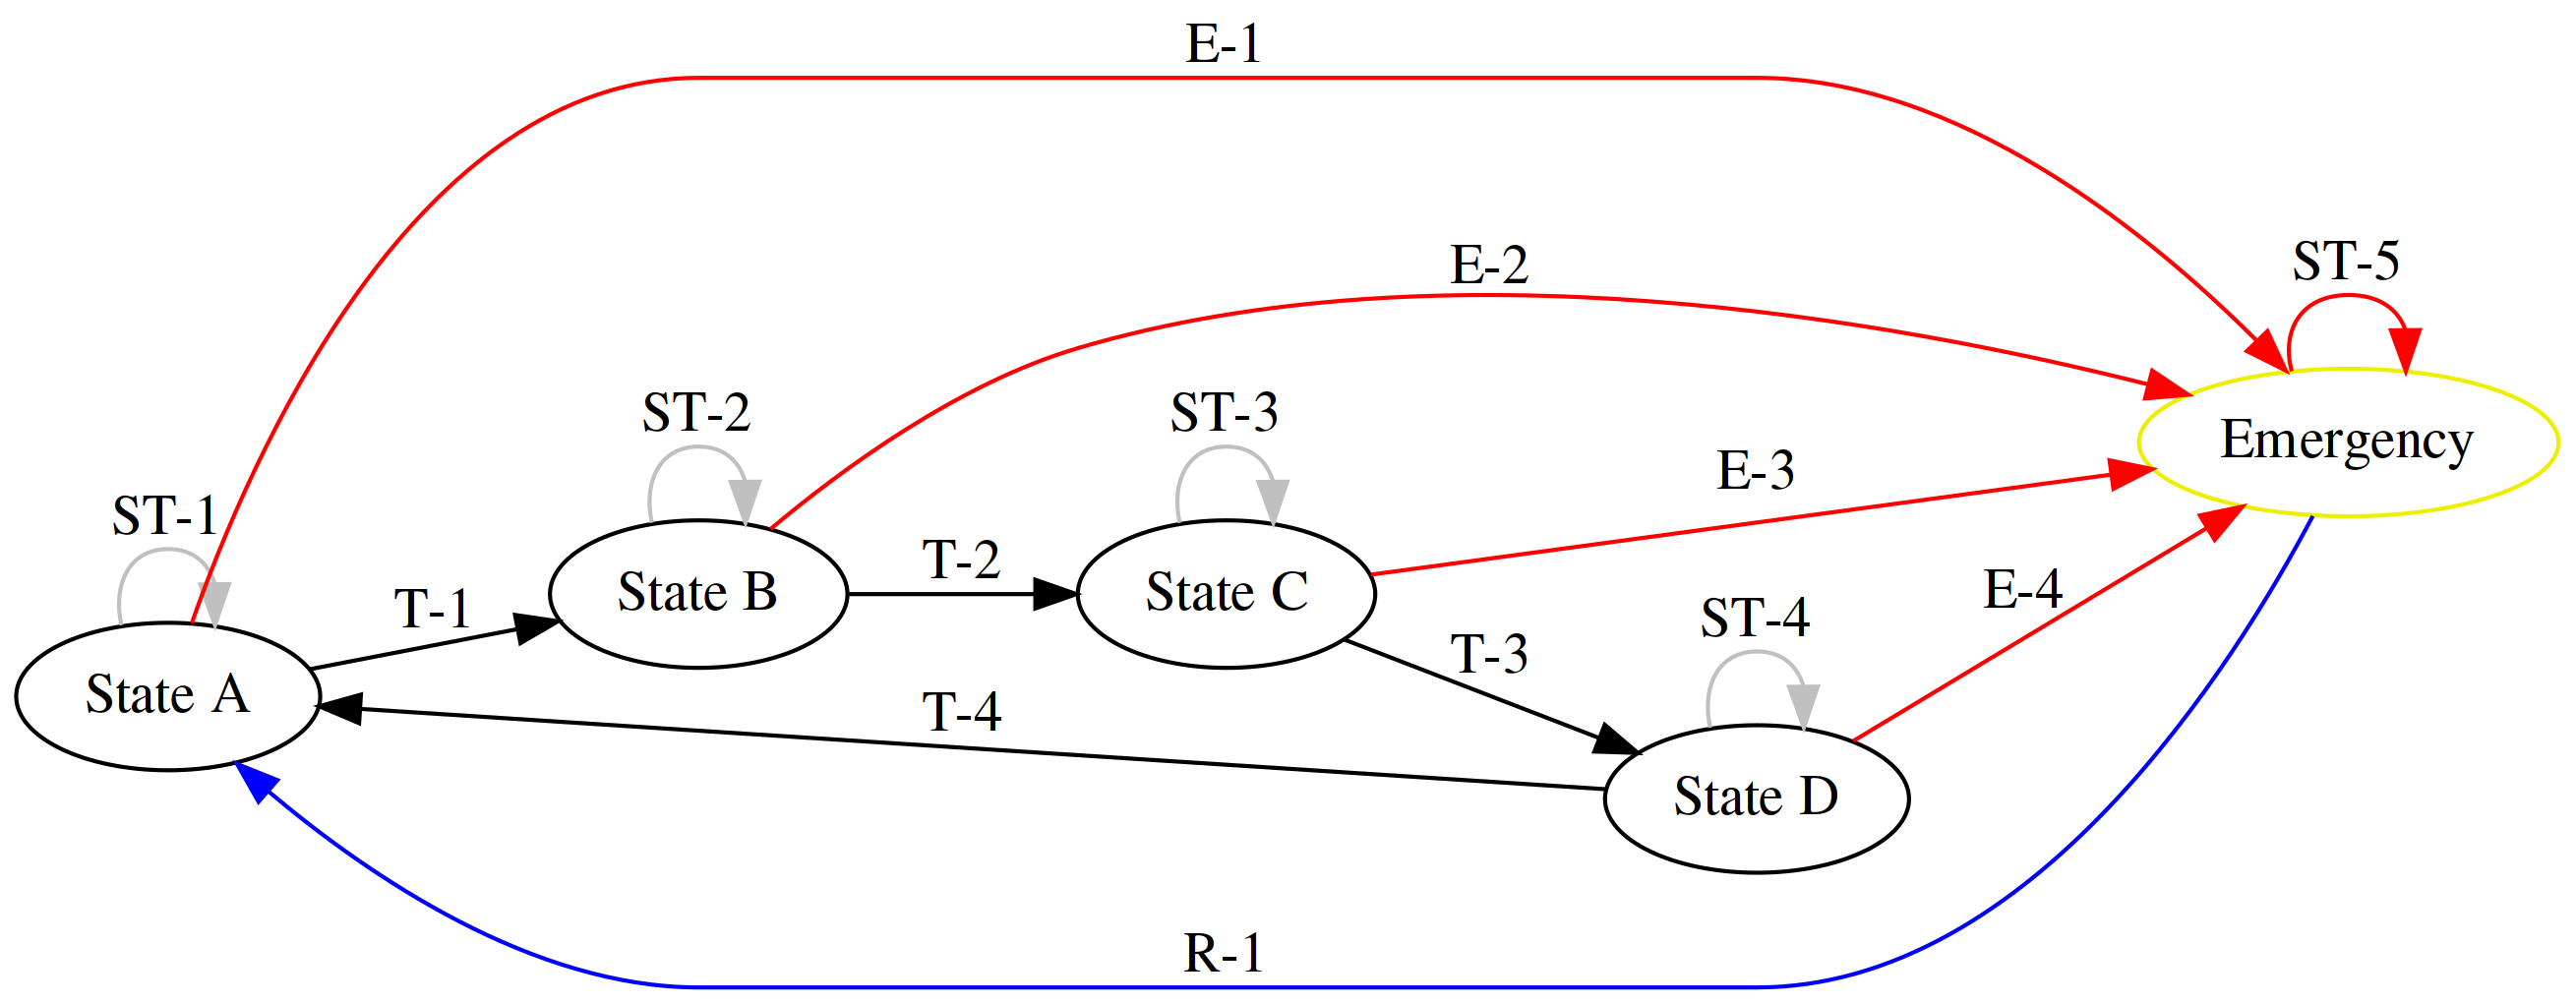
You will want to put this image in the same directory as a spreadsheet that explains every connection and their properties.
Tag |
Description |
|---|---|
T-1
|
“Start button pressed”
|
ST-1
|
PLC time loop ended
|
E-1
|
Emergency state called from state A
|
R-1
|
Machine being reset from emergency to state A
|
TestRun()